Monitor, measure, and improve your tabular models.
Achieve better results across accuracy, explainability, and fairness.
Identify Anomalies & Data Drift
Automatic out-of-distribution detection lets you identify where your model is likely making mistakes.
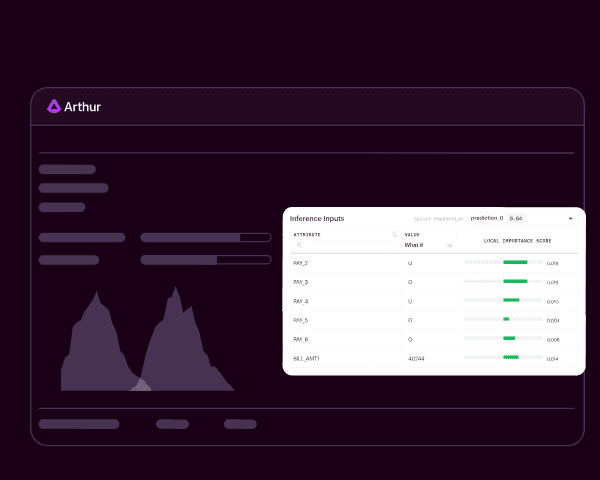
Use Explainability Techniques
Use explainability techniques to identify the most important features in determining the predictions of your models.
Quickly Mitigate Bias
Use Arthur’s proprietary techniques, or customize with your own metrics, to reduce business risk and prevent discrimination.