TLDR: We built an open-source integration that sends structured OpenInference traces to Arthur Engine, so you can see every LLM call, tool invocation, and error across your Claude Code sessions. Install in 30 seconds, works locally and in CI.
—
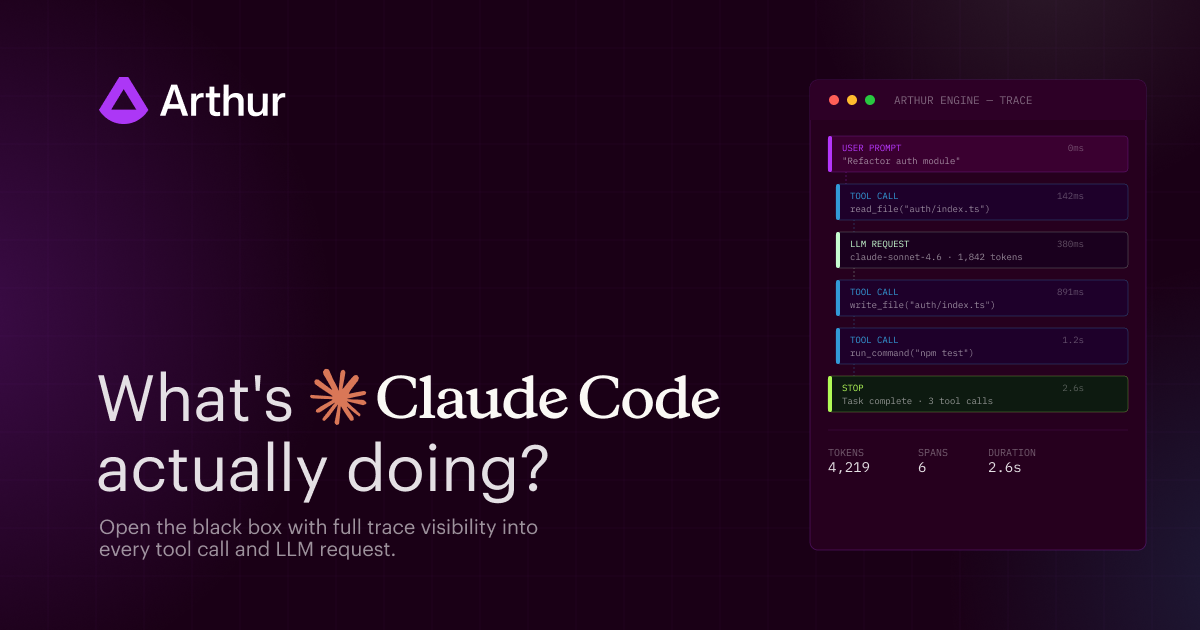
Claude Code is one of the most powerful agentic coding tools available today. You type a prompt, and it reads files, makes edits, runs searches, calls sub-agents, and fires off multiple LLM requests autonomously. It's fast, capable, and increasingly trusted for real engineering work.
But here's the thing: you don't see everything that's happening under the hood. Each turn is a black box. What are you sharing with Anthropic? Does it include passwords, api keys, etc? Which tool failed and got retried? Did it read the right files before making that edit? What operations did Claude Code perform throughout the session? You're trusting the process without being able to inspect it.
We built an open-source integration that changes that. It hooks into Claude Code's event system and sends structured OpenInference traces to Arthur Engine giving you full visibility into every turn, every tool call, and every LLM request.
From Black Box to Full Traces
Our Claude Code → Arthur Engine integration hooks into Claude Code's event system, specifically the UserPromptSubmit, PreToolUse, PostToolUse, PostToolUseFailure, and Stop hooks, and produces structured OpenInference traces.
Every user prompt becomes a trace. Within that trace, you get typed spans for each action Claude took:
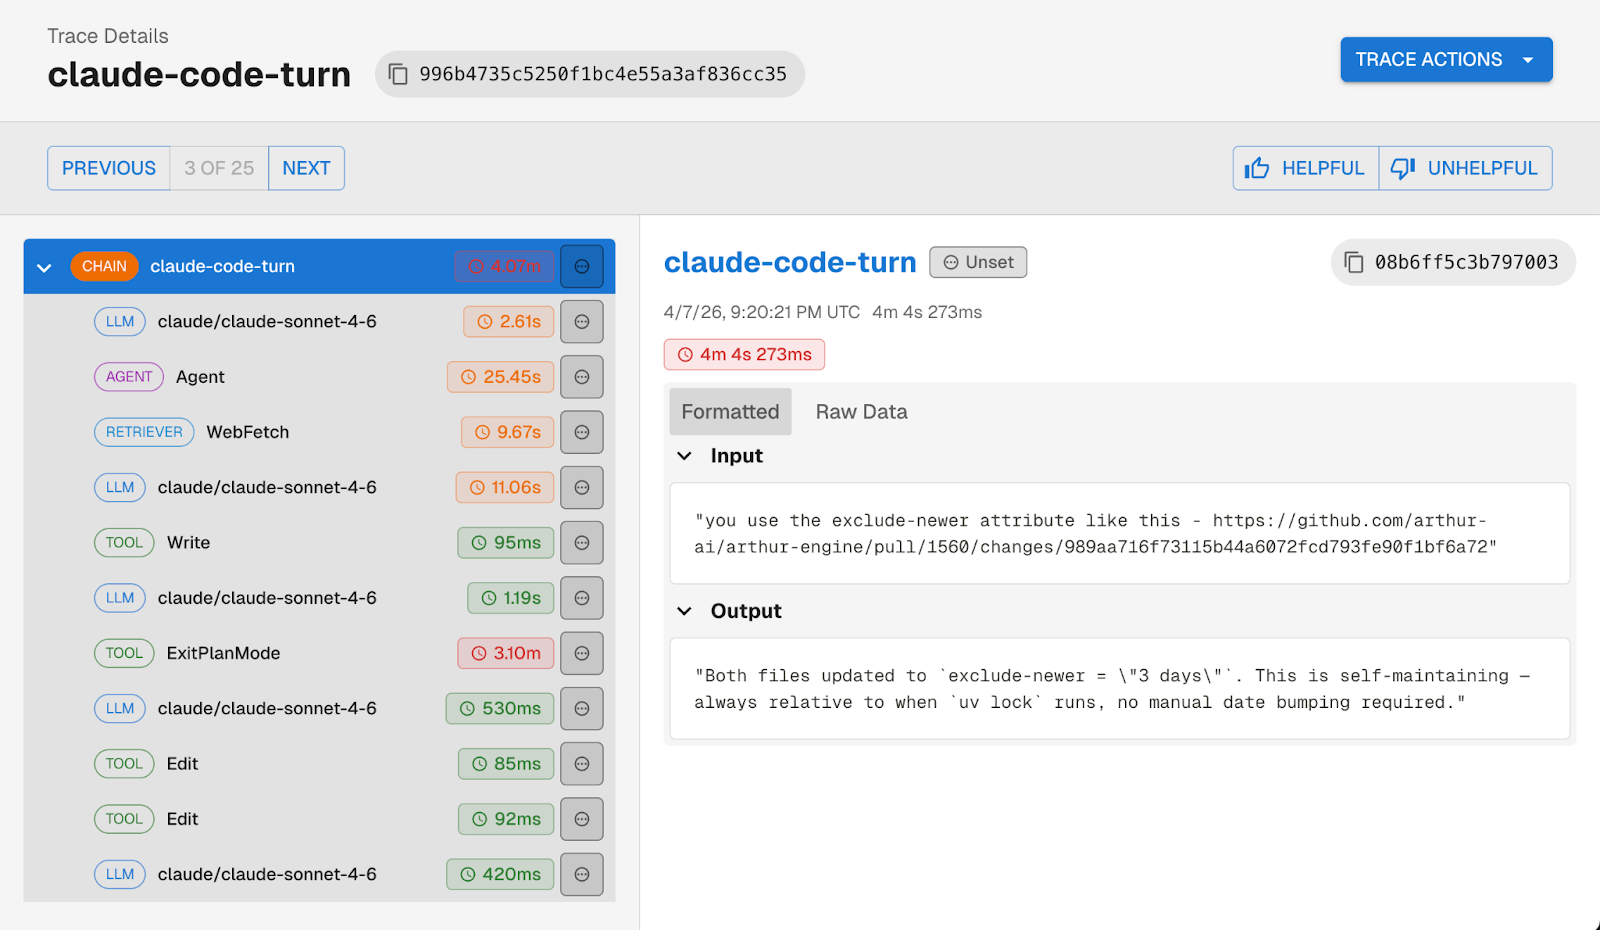
Tool failures show up as error spans rather than silently disappearing. Web searches and fetches are classified as RETRIEVER spans. Sub-agent calls get their own AGENT spans. And every trace is linked to a session, so you can follow a full Claude Code session across multiple prompts.
What You're Missing Without It
You might be wondering, doesn't Claude Code already have monitoring built in?
Claude Code does ship with OpenTelemetry log export. You can point it at any OTEL-compatible backend and get logs flowing but the logs are designed for administration, not developer observability. They won't tell you what prompts were sent, what tools returned, or why Claude made a particular decision.
You get a chronological stream of events: claude_code.api_request, claude_code.tool_decision, claude_code.tool_result, claude_code.user_prompt. Each line has a timestamp and an event type. That's useful for admin-level questions: rough timing, how many API calls happened in a session, etc.
But there's no span hierarchy connecting a user prompt to the tool calls and LLM requests it triggered. No prompt or completion content. No tool inputs or outputs. No error details on failed tool calls.
If you're running Claude Code in CI for automated PR reviews, or your team is using it daily for production codebases, flat logs aren't enough.
So What Can You Actually Do With This?
Once traces are flowing into Arthur Engine, a few things become possible that weren't before.
Catch sensitive data leaking into prompts. Claude Code sees your entire codebase and that means passwords, API keys, shared secrets, and other credentials can end up in user prompts sent to the LLM. With full traces in Arthur Engine, you can see exactly what's being sent in each prompt, flag sessions where sensitive data appeared, and build evals to catch it systematically.
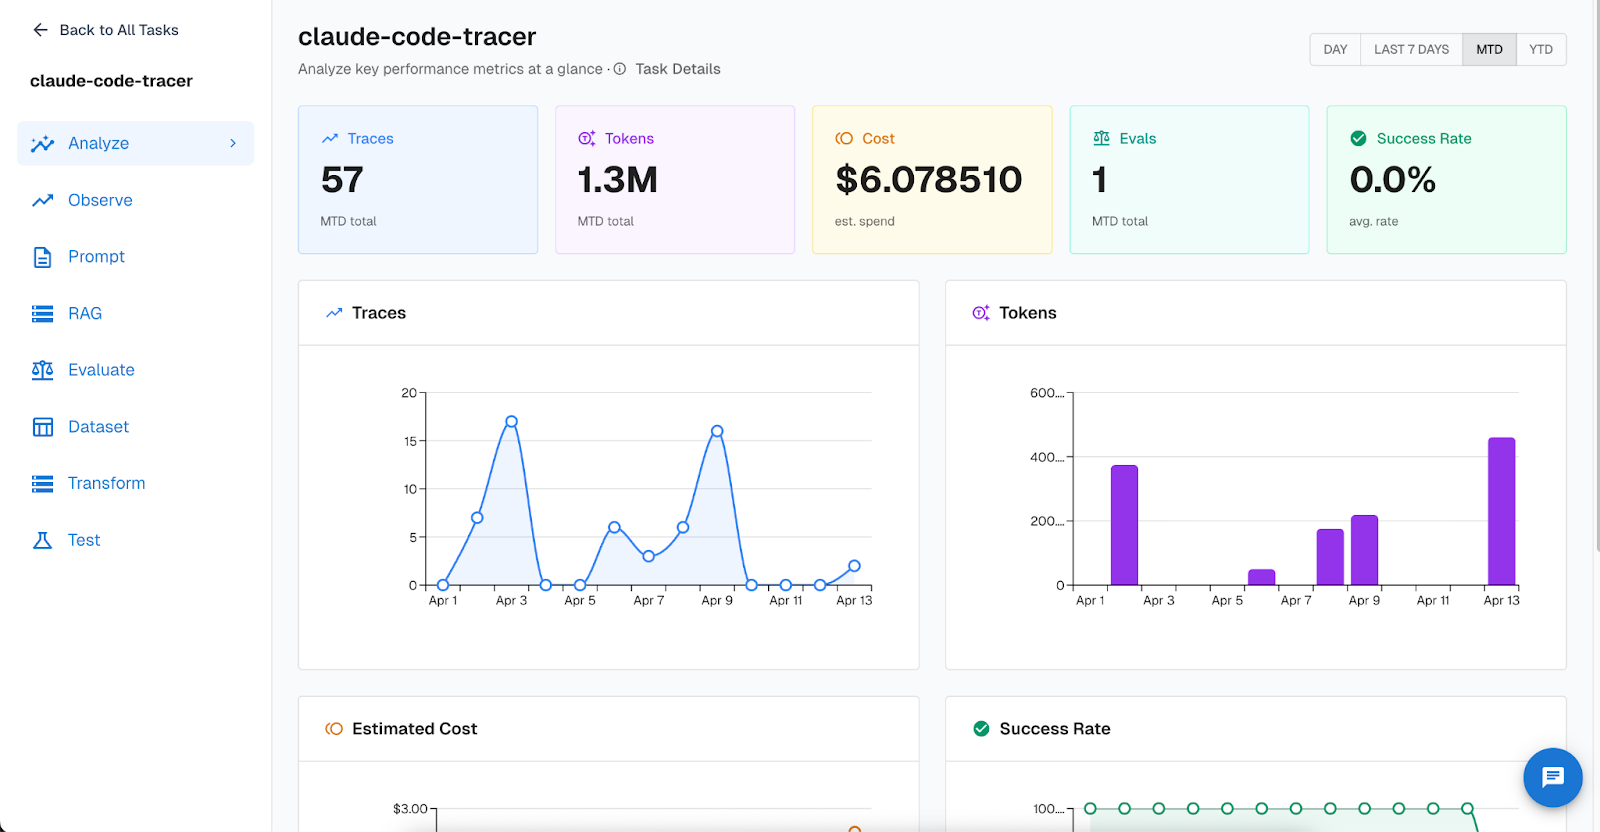
Track token usage and cost across your team. Arthur Engine's task dashboard gives you an at-a-glance view of your Claude Code usage: total traces, tokens consumed, estimated spend, and success rate over time. If you're trying to understand how much Claude Code is actually costing your team per week — or whether usage is spiking after a particular workflow change — the dashboard makes it concrete.
Light up your CI pipeline. If you're using Claude Code in GitHub Actions for automated PR review or @claude mentions on issues, you can trace those sessions too. The integration ships with ready-to-use workflow files just drop them into .github/workflows/ and configure a few secrets.
Ensure Claude Code is being used as intended. If your team has guidelines around what Claude Code should and shouldn't be used for, or you need end-to-end logging for compliance, traces give you a clear record of what each session actually did.
And since these are full OpenInference traces in Arthur Engine, you also get access to the broader platform: continuous evals running against your Claude Code traces, alerting on failure patterns, and the ability to build test datasets from real session traces.
Get Started
Install takes 2 easy steps. First clone the repo then pick your install mode:
git clone https://github.com/arthur-ai/arthur-engine.git
cd arthur-engine/integrations/claude-codesGlobal (trace all Claude Code sessions):
cd integrations/claude-code
cp .env.example .env   # add your Arthur Engine credentials
./install.sh
Per-project (scoped to one repo):
./install.sh --project-dir path/to/your/projectThe installer is idempotent, handles credential config, and registers the hooks automatically. If no credentials are configured, the tracer silently does nothing — safe to install everywhere you use Claude Code.
Full setup instructions, GitHub Actions workflows, and the source are on GitHub.
—
Claude Code is becoming core infrastructure for a lot of engineering teams. Like any infrastructure, it deserves observability. Give it a try and let us know what you find in your traces.
For a deeper dive on agent observability, tracing, evals, and prompt management, check out our Best Practices for Building Agents series.
SHARE


