.png)
Welcome to the first installment of our multi-part series on building reliable AI agents. Many teams have already learned the hard way that moving agents from demos to production is difficult. This series distills lessons from our Forward Deployed Engineering team, based on real-world deployments of production agents across industries.
In this post, we focus on observability and tracing, foundational capabilities for operating agents your customers can trust.
Why Observability Matters
Two engagements from our FDE team illustrate this well. One customer was preparing to roll out their agent to pilot customers and had no idea where to start improving it. Should they focus on RAG tuning, prompt tuning, or context engineering? By instrumenting their agent with tracing, they could investigate the specific requests where the agent got the wrong answer, see exactly where it deviated from expected behavior, and focus their limited resources on the changes that mattered most.
Another customer was selling their agent to large enterprise buyers who needed proof the agent was trustworthy before rolling it out across their organization. Collecting detailed traces allowed them to build a behavior dataset of real customer requests, establishing the evidence their buyers needed to move forward. In both cases, the teams that invested in observability early were the ones that shipped with confidence, and the ones that didn't were stuck in demos.
OpenTelemetry and Semantic Conventions
OpenTelemetry has emerged as the standard for vendor-neutral observability. Its biggest advantage is portability: you can emit traces once and choose any compatible backend without re-instrumenting your code. This matters because agents rarely live in isolation. They span services, APIs, databases, and often other agents. OpenTelemetry's distributed tracing model lets you follow an agent execution end to end, even as it crosses system boundaries.
Within OpenTelemetry, there are two competing semantic conventions for encoding agent behavior into spans: the OTEL-community GenAI semantic conventions and the open-source OpenInference standard. When building the Arthur platform, we chose OpenInference because it offers several advantages for production agent workloads:
- Richer semantic detail for LLM calls, including full prompt/completion, token, cost, and model parameter metadata
- First-class support for retrieval and re-ranking spans, critical for RAG-heavy agents
- Better distinctions between different span types (LLM, TOOL, AGENT, CHAIN, RETRIEVER, etc.)
- Explicit types for messages (system, user, assistant, and tool), documents, tools, and tool calls
- Out-of-the-box auto-instrumentation for popular LLM frameworks (LangChain, LlamaIndex, OpenAI, etc.)
- Open source with an active community and rapid iteration
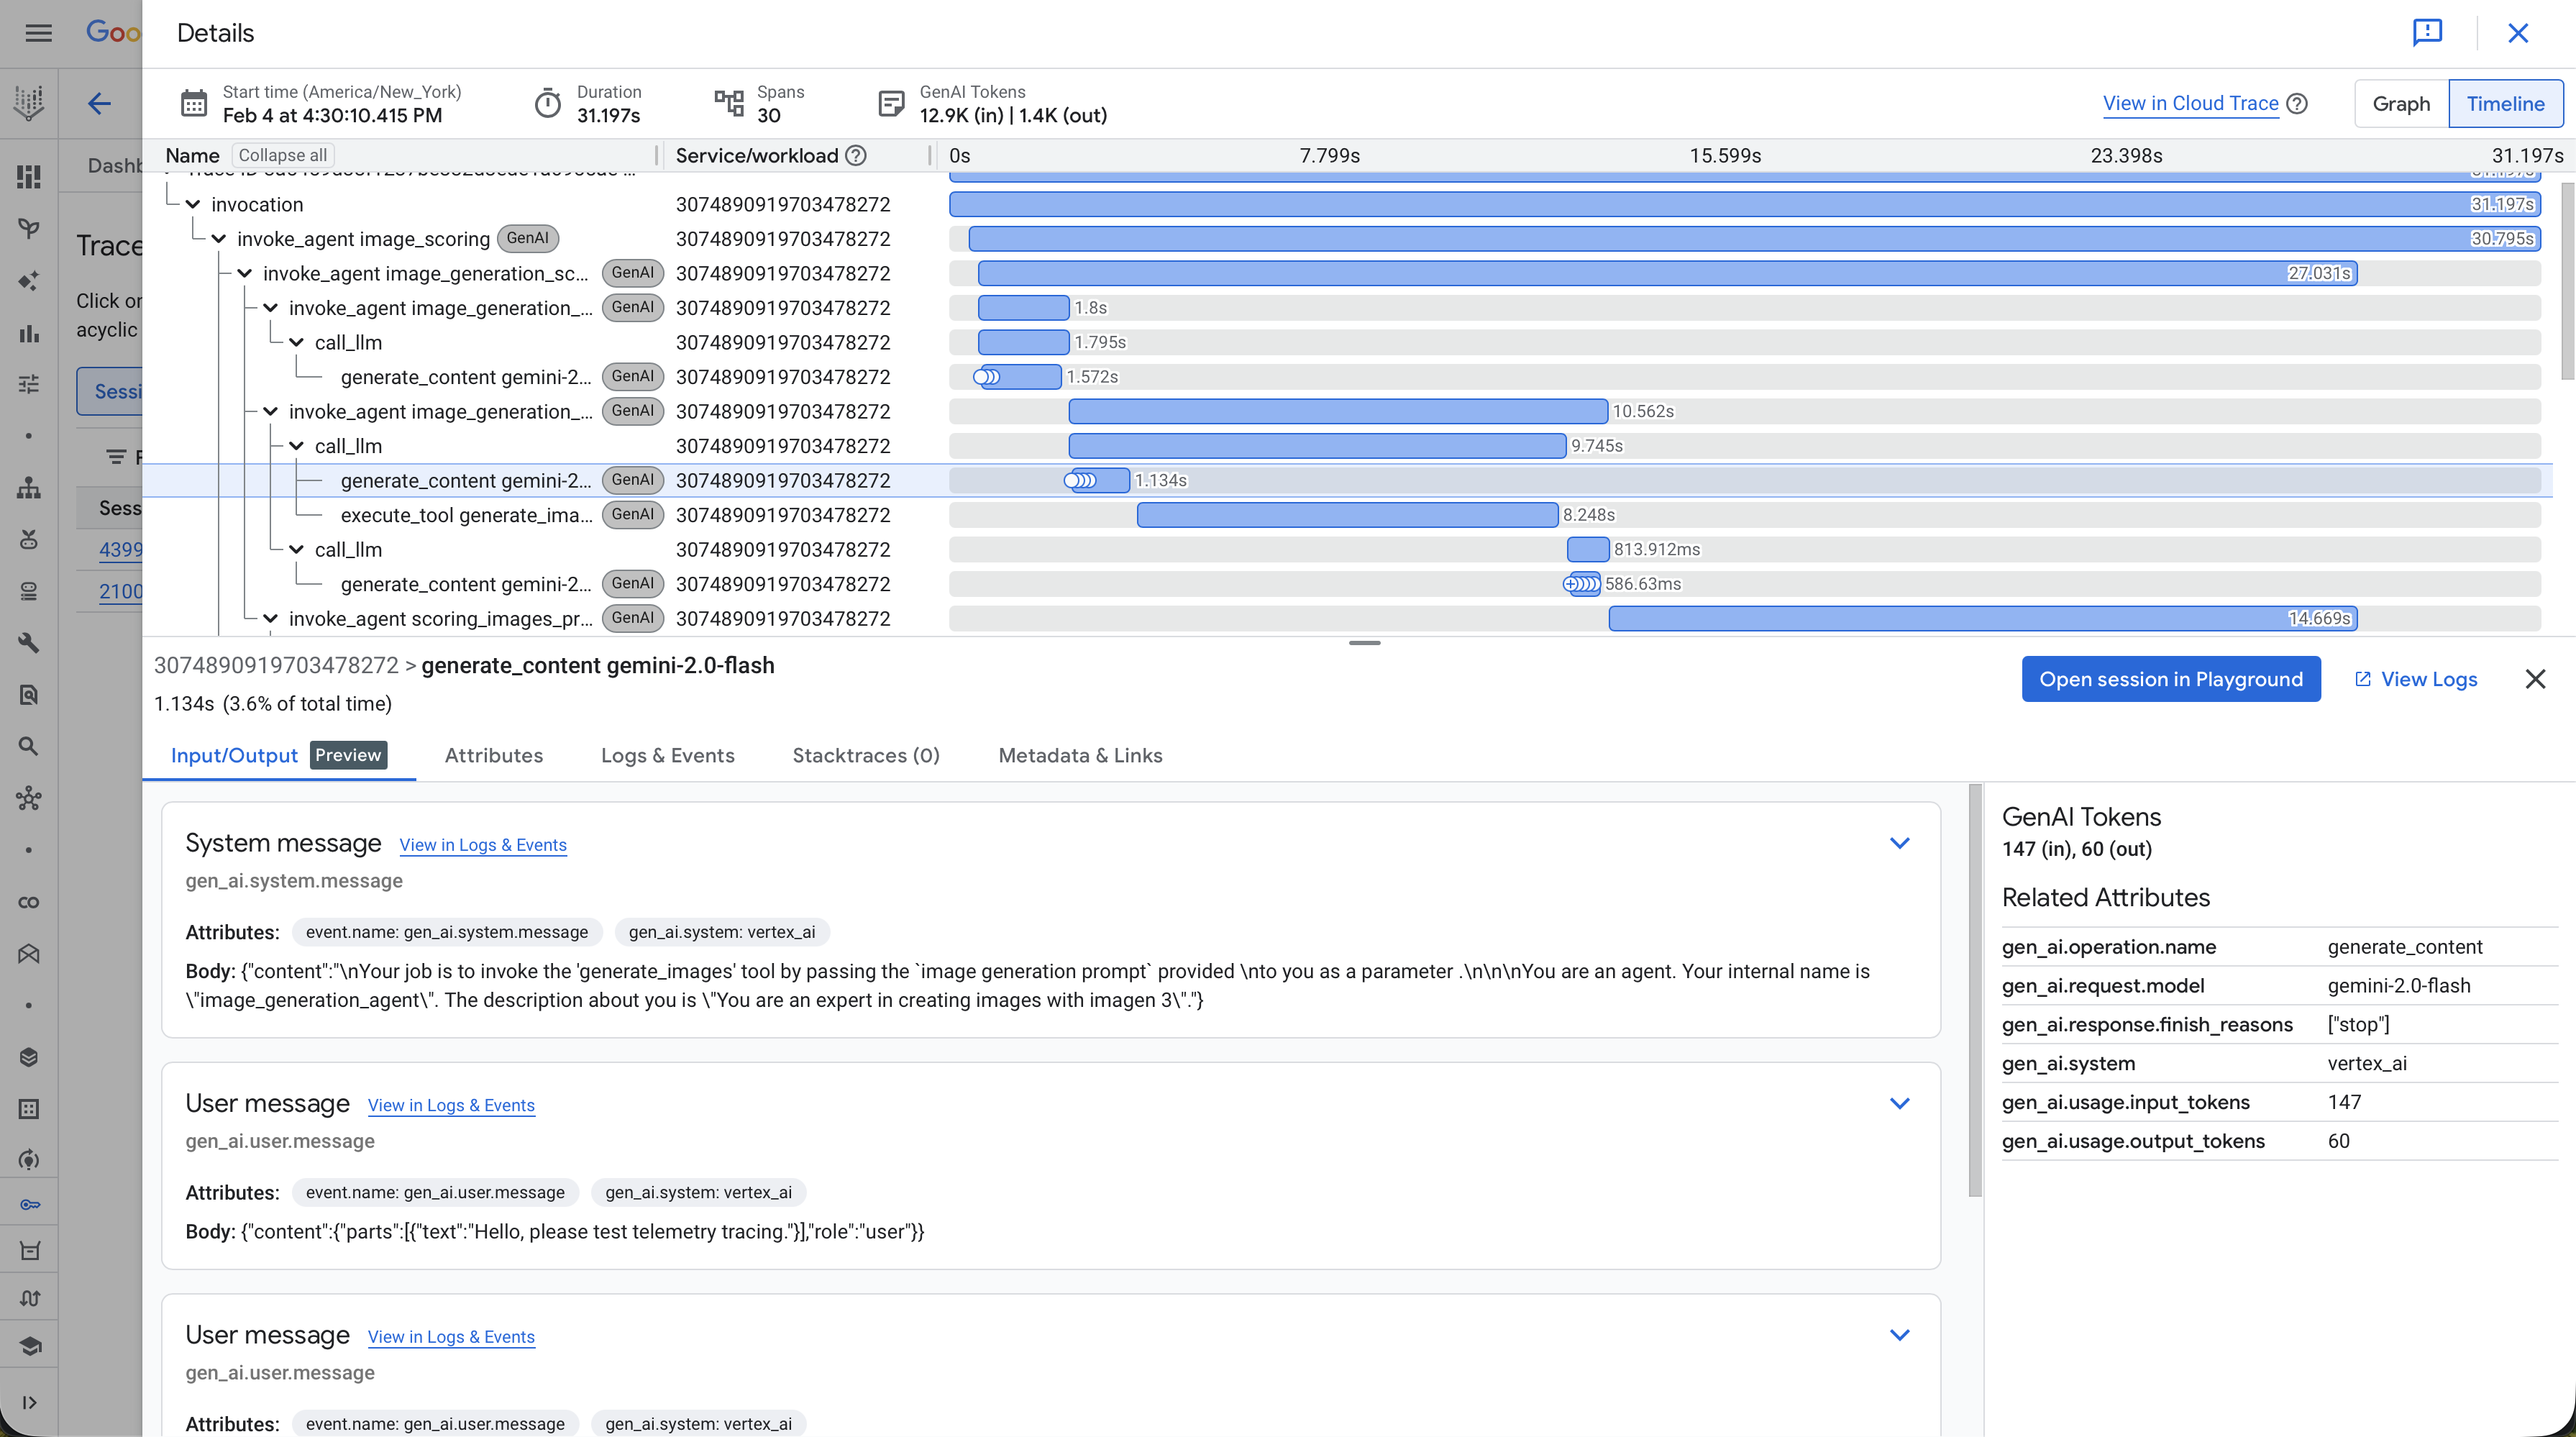
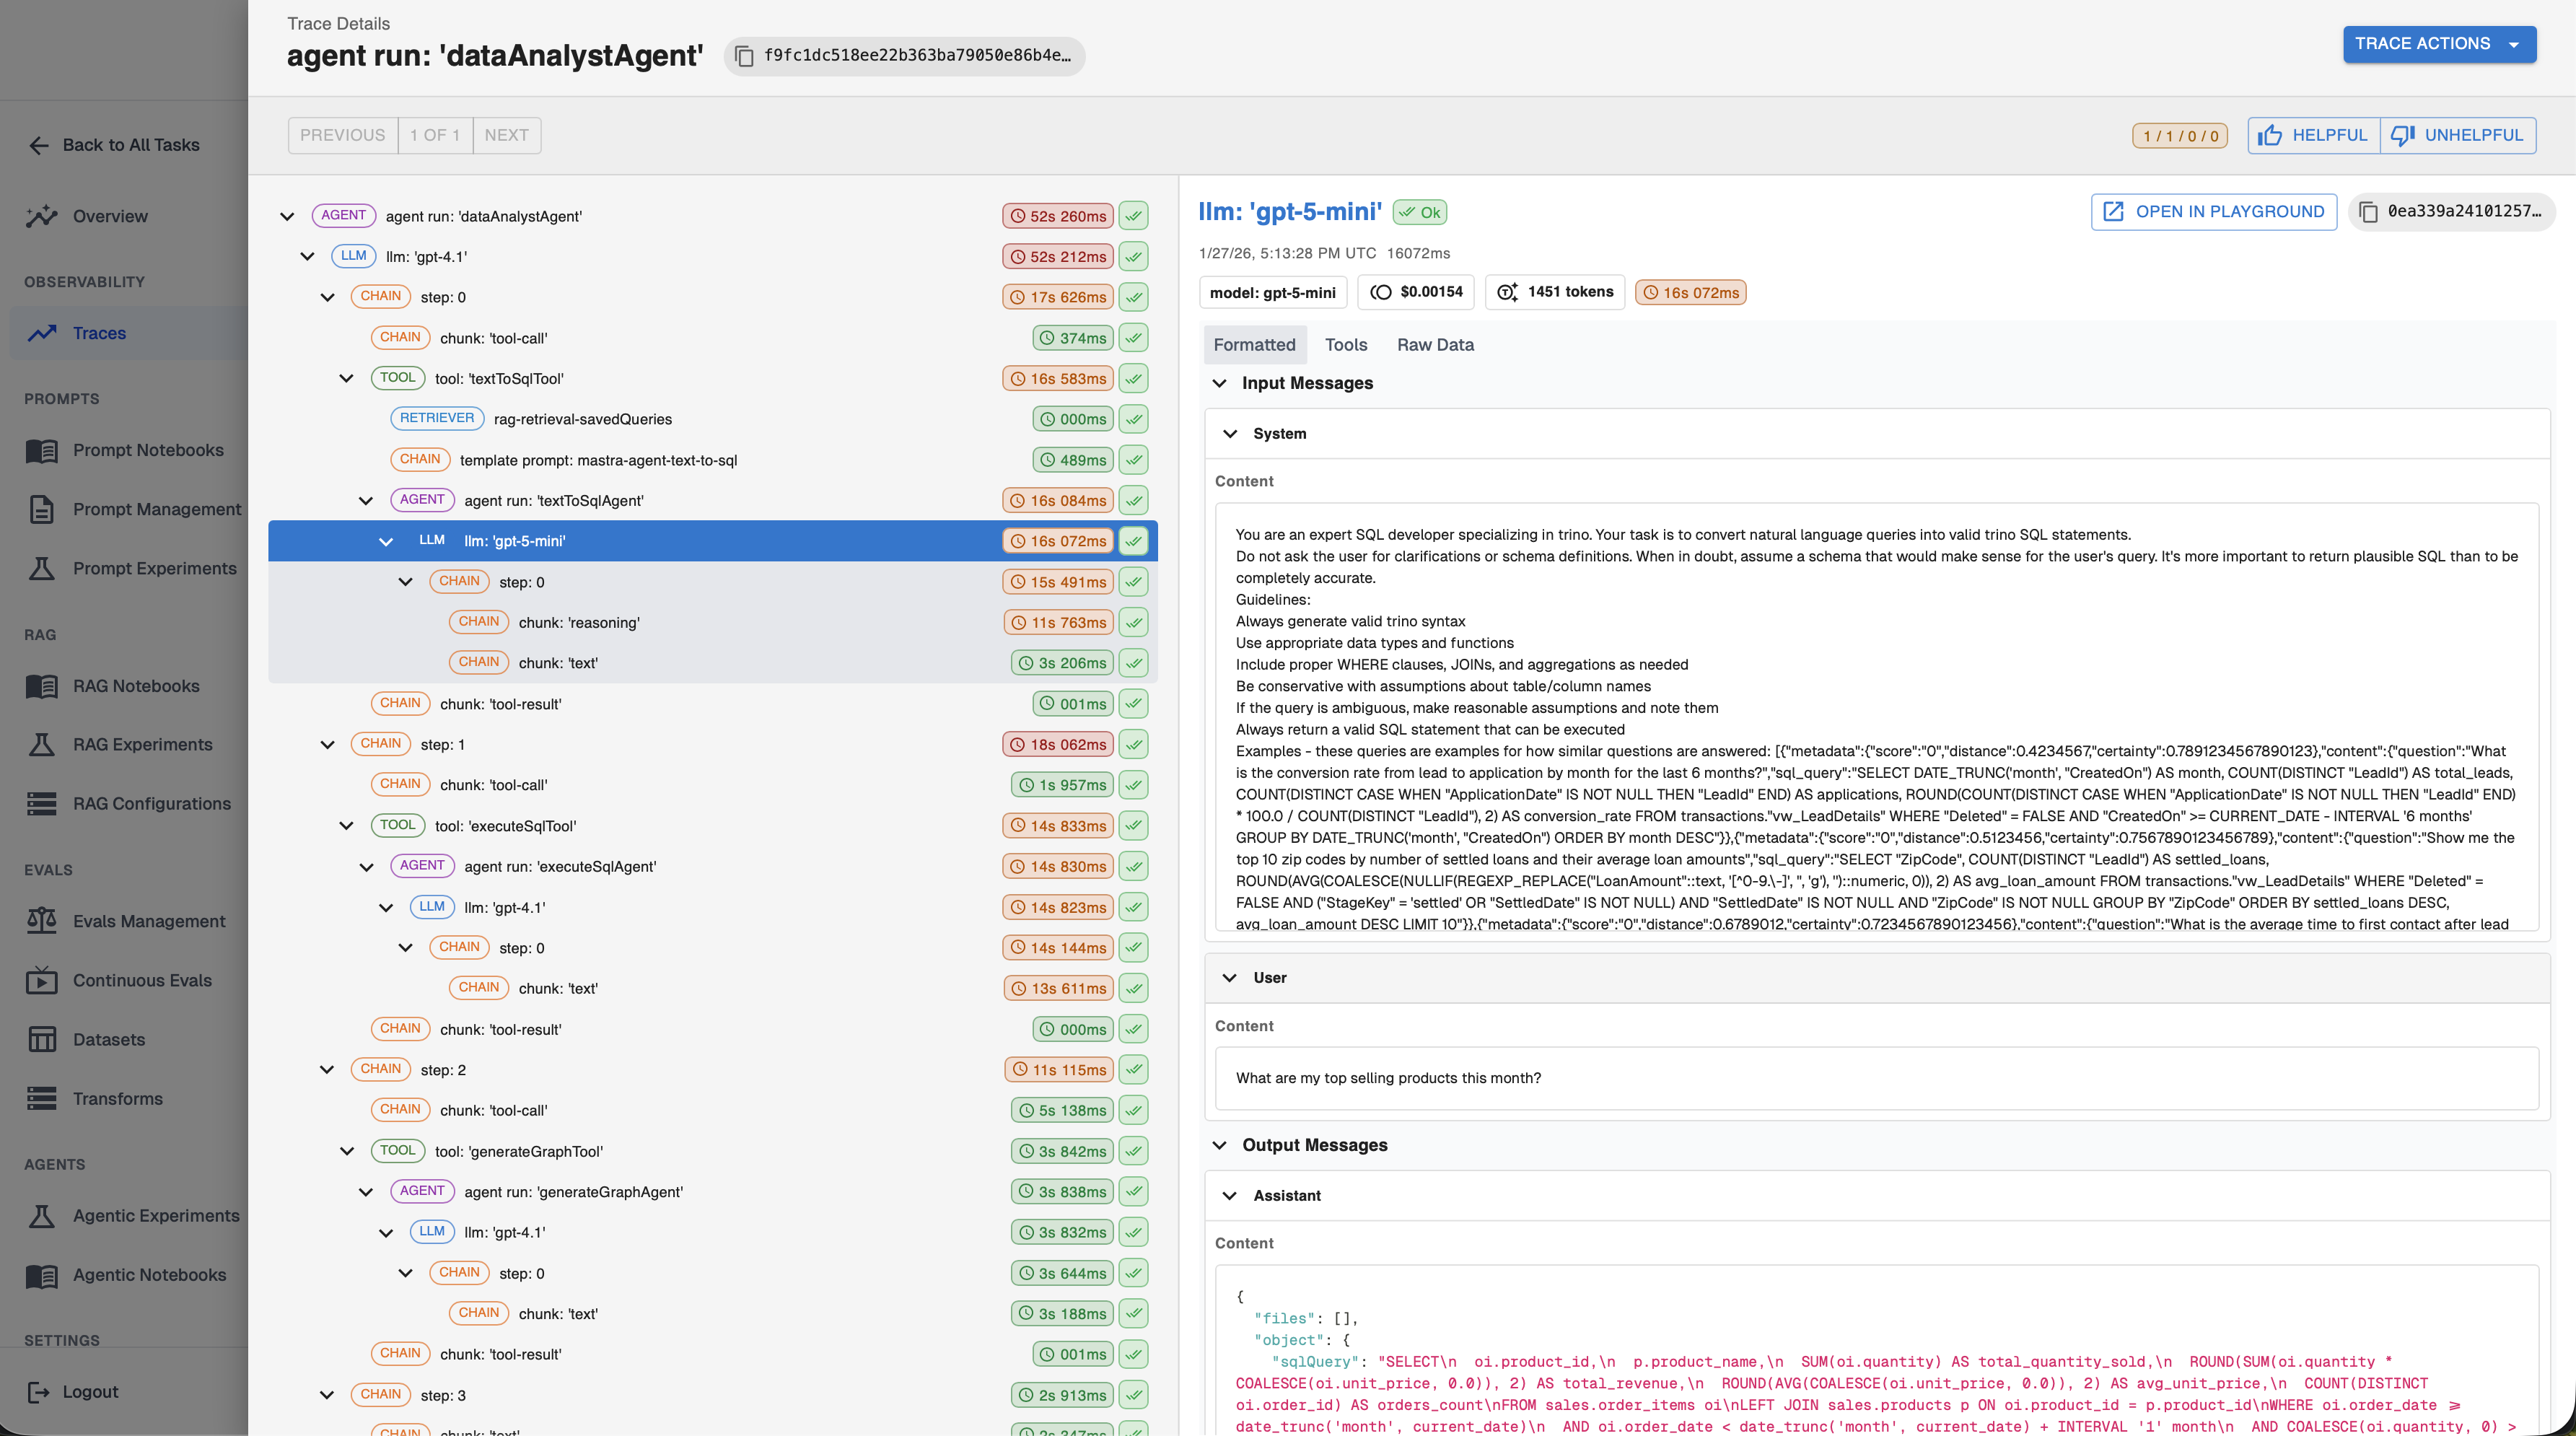
The OTEL GenAI conventions are catching up, but today they are still lacking the expressiveness of the OpenInference conventions. The difference is stark when you compare traces side by side:
What to Trace
Most common agent frameworks have great auto-instrumentation packages for OpenTelemetry. For example, adding OpenInference tracing to Google's ADK is as simple as adding these few lines of Python code (docs can be found here):
tracer_provider = trace_sdk.TracerProvider()
tracer_provider.add_span_processor(SimpleSpanProcessor(ConsoleSpanExporter()))
GoogleADKInstrumentor().instrument(tracer_provider=tracer_provider)
It's worth noting that the auto instrumentation may not pick up everything you need to trace for your agent. At minimum, instrument these five areas:
- LLM calls: Trace every interaction with full context: prompts, completions, model configuration, token counts, and cost. Without this, debugging unexpected outputs or reasoning about performance tradeoffs is nearly impossible.
- Tool invocations: When an agent calls an API, queries a database, or executes code, capture inputs, outputs, and latency. Many performance issues come down to inefficient tool usage that only becomes obvious when laid out in a trace.
- RAG calls: Agents often take wrong actions because they had bad context. Tracing retrieval calls lets you see exactly which documents were pulled, and often more importantly, which documents were not, and why the model acted on them.
- Application metadata: User IDs, session IDs, and domain identifiers connect agent behavior back to real user experiences. When a customer reports an issue, pulling up the exact traces for their session dramatically shortens time to resolution.
- Key decision points: Make sure spans include key decision points or context important for the agent to function correctly. In our FDE engagements, we often see customers add manual spans at these points, then use the logged context to build test datasets and continuous evals to validate behavior in production.
(Continuous evals will be covered in more detail in a following post in this series).
Agent Frameworks with Strong Observability Support
If you're starting a new agent project, choosing a framework with built-in observability can save significant effort than having to instrument manually. These frameworks have great out-of-the-box support for OpenTelemetry and can be easily integrated with existing tracing infrastructure.
- Google ADK includes built-in OpenTelemetry instrumentation for agent actions, LLM calls, prompts, and responses. It integrates tightly with Google Cloud's logging, monitoring, and tracing services, making it a natural choice for teams on GCP.
- Mastra provides comprehensive, out-of-the-box OpenTelemetry support. It automatically traces agents, LLM calls, tools, workflows, integrations, and database operations using standardized GenAI semantic conventions. Mastra supports both exporting traces to any OTEL-compatible backend and a bidirectional OpenTelemetry bridge that integrates seamlessly with existing enterprise tracing infrastructure.
- AWS Strands offers native OpenTelemetry support with auto-instrumentation and standardized attributes. It supports a variety of OTEL-compatible backends and is well-suited for teams already operating in the AWS ecosystem.
- CrewAI provides built-in tracing through its AMP platform and can also be instrumented using OpenInference to export data to OpenTelemetry-compatible backends. This flexibility makes it a viable option for teams that want strong observability without committing to a single vendor stack.
TLDR
In this post we covered why it's critical to have strong observability for agents. Without it, your agent will struggle to make it into production.
If there's one thing to take away from this post, it's to set up tracing for your agent! Ideally, use the OpenInference semantic conventions too.
Up Next
In the next post in this series, we'll explore prompt management and testing techniques, and how to use traces to catch regressions before they hit production.
Interested in building agents or agent observably? Connect with me on LinkedIn!
If you'd like to learn more about shipping reliable agents using these best practices, book a demo with an AI expert.
Want to see how we've applied these best practices internally? Check out our agent building stories: How We Turned a Vibe-Coded Jira Bot Into a Reliable Agent in Two Weeks & What "Building an Agent" Actually Means (And Why Most People Get It Wrong).
SHARE